
Avocado Exports: Overview
Avocado exports in the world presented an average annual increase of 12.5% during the period 2011-2020. In 2020, the increase was 9.7% with respect to 2019, going from 2,645,803 to 2,901,473 tons, with Mexico being the largest avocado exporter and the United States the largest importer in 2020, according to FAOSTAT, FAO’s main database.

Main avocado exporters
In 2020 Mexico led avocado exports with 1,158,894 tons and a value of 2,746 million dollars, accounting for 41.4% of the total volume and 41.1% of the total value of world exports.
In second and third place were Peru and the Netherlands with 410,697 and 375,685 tons, which represented 14.7% and 13.4% of the total volume of avocado exported in the world, respectively; completing the first five positions were Spain with 5.0% and Chile with 3.5%.
Main avocado exporting countries in 2020
| Country | Volume (t) | Volume (%) | Value ($M) | Value (%) |
| Mexico | 1,158,894 | 41.4 | 2,746 | 41.1 |
| Peru | 410,697 | 14.7 | 759 | 11.4 |
| Netherlands | 375,685 | 13.4 | 1,183 | 17.7 |
| Spain | 141,031 | 5.0 | 454 | 6.8 |
| Chile | 96,906 | 3.5 | 251 | 3.8 |
Source: FAO-FAOSTAT/ProducePay 2020
Main avocado importers
The United States is the country that annually imports the most avocado, reaching 1,116,896 tons, which translated into 38.5% of the world total and generated 2,541 million dollars.
Something that is striking is that the following countries on the list are from Europe: the Netherlands, Spain, France and Germany, which indicates that the European market is consolidating, something that is of course attractive for exporters, especially in South America.
Main avocado importing countries in 2020
| Country | Volume (t) | Volume (%) | Value ($M) | Value (%) |
| United States | 1,116,896 | 38.5 | 2,541 | 34.0 |
| Netherlands | 414,175 | 14.3 | 1,208 | 16.2 |
| Spain | 174,266 | 6.0 | 390 | 5.2 |
| France | 170,542 | 5.9 | 517 | 6.9 |
| Germany | 122,340 | 4.2 | 385 | 5.2 |
Source: FAO-FAOSTAT/ProducePay 2020
Avocado trade flows
The main avocado trade flow in the world is the volume that Mexico sends to the United States, 925,218 tons with a value of 2,214 million dollars in 2020. Then comes the avocado flow from Peru to the Netherlands and the avocado flow from the Netherlands to Germany; this is because the Netherlands is currently the main entry point to Europe for South American avocados.
Main global avocado trade flows in 2020
| Origin | Destination | Volume (t) | Volume (%) | Value ($M) | Value (%) |
| Mexico | United States | 925,218 | 34.5 | 2,214 | 34.0 |
| Peru | Netherlands | 137,299 | 5.1 | 254 | 3.9 |
| Netherlands | Germany | 96,939 | 3.6 | 342 | 5.3 |
Source: FAO-FAOSTAT/ProducePay 2020
Avocado exports from Mexico
Avocado is a product of great economic importance for Mexico, since a large part of the production is exported to the United States, constituting in 2020 the 2nd agri-food product that left the country with more income from exports, with 3,153 million dollars, only behind beer.
Where is Mexican avocado exported to?
The main destination for Mexican avocado exports is the United States, to which 77.0% of the total volume exported in 2020 was sent, although if we focus on the value represented by this volume, then we are talking about 86.4% of the total.
The second destination was Canada with 6.8% and the third one was Japan with 5.3% of exports. In addition, during the period mentioned, Mexican avocados were exported to 43 countries. Learn more about Mexican avocado production and exports.
Main destinations for avocado exports from Mexico (2020)
| Country | Volume (t) | Volume (%) | Value ($M) | Value (%) |
| United States | 1,036,562 | 77.0 | 2,300 | 86.4 |
| Canada | 91,933 | 6.8 | 205 | 7.7 |
| Japan | 70,943 | 5.3 | 157 | 5.9 |
| Other countries | 146,778 | 10.9 | 0 | 0.0 |
| Total | 1,346,215 | 100.0 | 2,662 | 100.0 |
Source: SE-SIAVI/ProducePay 2022
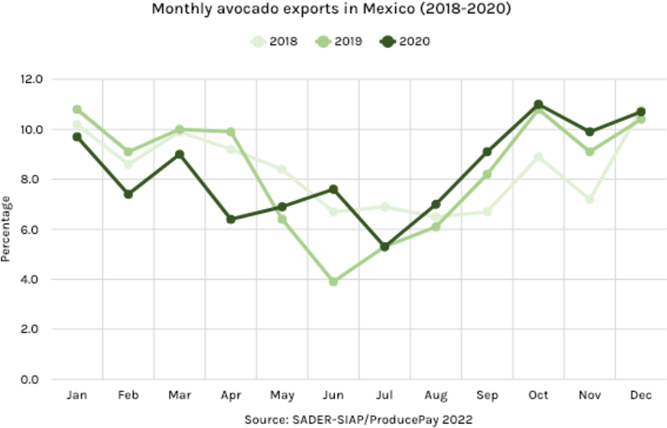
What is the seasonality of Mexican avocados?
The peak export season is from October to January, being the season of the highest consumption in the United States from September to March, with specific peaks in demand during the Super Bowl and Cinco de Mayo, the two times of the year of the highest avocado consumption.
As for the low part of the season, it normally runs from May to July, although in 2020 there was an important upturn in the month of June, although this was not the only difference, since even though the general trend is observed, there are significant variations in several months.
Avocado exports from Peru
The avocado is a product of great economic importance for Peru, as in 2020 it was the 3rd agri-food product that left more income with 759 million dollars, only after blueberries and grapes.
Where is Peruvian avocado exported to?
In 2020, the main destination for Peruvian avocado was the Netherlands, where 137,299 tons were shipped, representing 33.4% of the total volume exported, leaving an income of 255 million dollars. The second destination was the United States, where 19.5% of the exported volume was sent.
Spain was in 3rd position with 72,175 tons and 131 million dollars, so it is clear that Peru is focused on the European market, mainly because Mexico dominates the U.S. market and with minimal presence in Europe.
Main destinations for avocado exports from Peru (2020)
| Country | Volume (t) | Volume (%) | Value ($M) | Value (%) |
| Netherlands | 137,299 | 33.4 | 255 | 33.5 |
| United States | 79,897 | 19.5 | 158 | 20.8 |
| Spain | 72,175 | 17.6 | 131 | 17.3 |
| Other countries | 121,325 | 29.5 | 215 | 28.4 |
| Total | 410,696 | 100.0 | 759 | 100.0 |
Source:FAO-FAOSTAT/ProducePay 2022
Other avocado exporting countries
Other countries in the Americas that stand out in terms of avocado exports are Chile, Colombia and the Dominican Republic, which, like Peru, also have the Netherlands as their main market, where they have found the entrance to the European Union.
This situation occurs because Mexico covers about 90% of U.S. avocado imports, so there is little room for other countries, but Mexico has little presence in Europe, a situation they are taking advantage of. Learn more about the current avocado market situation.
Avocado imports in the United States
In the last 15 years the availability of avocado in the U.S. market has tripled, but it is estimated that there is still a lot of room to grow in the following years, so it is very likely that imports will continue to increase.
In addition, the consumption trend will also benefit domestic production, although we must not lose sight of the fact that California, the main producing state, faces serious water and labor shortages. Learn more about the current situation of the fresh avocado market in the United States.
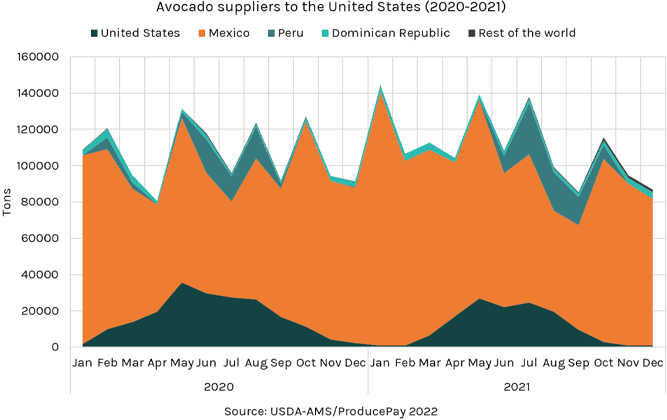
Who supplies avocados to the United States?
Mexican avocados dominate the U.S. market, shipping 1,085,351 tons in 2021, which represented 89.4% of total imports of this product, and presenting considerable year-on-year increases.
Peru and the Dominican Republic are in the second and third positions with 84,529 and 36,219 tons shipped in 2021, respectively, and both countries are steadily increasing their volume of shipments.
Main avocado suppliers to the United States (2018-2021)
| Country | Volume (t) | |||
| 2018 | 2019 | 2020 | 2021 | |
| Mexico | 903,890 | 976,428 | 1,004,604 | 1,085,351 |
| Peru | 81,893 | 85,174 | 77,400 | 84,529 |
| Dominican Republic | 26,082 | 27,041 | 30,041 | 36,219 |
| Chile | 25,642 | 14,925 | 1,201 | 4,074 |
| Colombia | 288 | 1,602 | 3,211 | 3,236 |
| Other countries | 0 | 20 | 40 | 0 |
| Total | 1,037,797 | 1,105,190 | 1,116,498 | 1,213,411 |
Source: USDA-ERS/ProducePay 2022
Avocado seasonality in the United States
Domestic production begins in March and ends in September, but the largest volume enters between May, June and July, that is, during the summer. Mexico ships throughout the year, although the volume is higher during the first half of the year than during the second half.
Peru, on the other hand, provides its volume between May and November, with July and August being the most important months, while the Dominican Republic makes minimum shipments throughout the year, without showing a peak. Learn more about the avocado seasonality in the U.S. market.
Avocado price in the United States
The average annual price for avocados imported by the United States has been declining in recent years, with a price of 2.98 usd/kg in 2017 and 2.53 usd/kg in 2021, which is a response to the substantial increase in volume.
The highest prices of the season usually occur between April and September, while the lowest prices are usually between October and February. In 2021 the maximum price was 3.06 usd/kg in September.
Prices tend to fall towards the end of the year because this is when Mexico exports more avocados to the United States and, conversely, between April and July Mexico ships its lowest volumes, so the price rises in those months.
Prices of fresh avocado imported by the United States (usd/kg)
| Jan | Feb | Mar | Apr | May | Jun | Jul | Aug | Sep | Oct | Nov | Dec | Year | |
| 2017 | 2.13 | 2.55 | 2.89 | 3.17 | 3.24 | 2.95 | 2.85 | 4.03 | 4.50 | 2.76 | 2.22 | 2.49 | 2.98 |
| 2018 | 2.14 | 2.18 | 2.25 | 2.50 | 2.30 | 2.22 | 2.34 | 2.91 | 2.37 | 2.03 | 2.23 | 1.73 | 2.27 |
| 2019 | 1.76 | 1.73 | 2.00 | 3.43 | 3.34 | 3.73 | 3.33 | 3.06 | 2.44 | 2.15 | 2.00 | 2.06 | 2.59 |
| 2020 | 2.32 | 2.82 | 3.02 | 2.61 | 2.44 | 2.34 | 2.15 | 2.18 | 1.97 | 1.71 | 1.54 | 1.55 | 2.22 |
| 2021 | 1.72 | 1.88 | 2.72 | 2.69 | 2.46 | 2.29 | 2.52 | 2.98 | 3.06 | 2.49 | 2.61 | 2.93 | 2.53 |
| Month | 2.01 | 2.23 | 2.58 | 2.88 | 2.76 | 2.71 | 2.64 | 3.03 | 2.87 | 2.23 | 2.12 | 2.15 | 2.52 |
Source: USDA-ERS/ProducePay 2022
Requirements for exporting avocados to the United States
It is important to mention that U.S. avocado import requirements vary for each country of origin; review the avocado import requirements by country.
For the Mexican avocado, the only admissible part of the plant is the fruit, which may enter through all ports, although the product is subject to inspection at the port of entry to ensure compliance with the general import requirements for fruits and vegetables established in 7 CFR § 319.56-3 of the Federal Code of Regulations, in addition to the APHIS permit PPQ-587.
Currently, only Hass avocados from the states of Michoacan and Jalisco are allowed to be imported from Mexico into the United States.
Conclusion
World avocado exports have increased by an average of 12.5% each year from 2011 to 2020, a trend that will apparently continue for at least a couple of years, making this agri-food product extremely important economically, mainly for the countries most involved in its trade flow, such as Mexico, the United States, Peru and the Netherlands.
Sources:
FAO-FAOSTAT. Crops and livestock products – Avocado trade
https://www.fao.org/faostat/es/#data/QCL
PROMPERU. Desenvolvimiento del Comercio Exterior – Informe Anual 2020: palta.
https://exportemos.pe/exportador-regular-agronegocios
SADER-SIAP. Food & Agricultural Overview – avocado
http://nube.siap.gob.mx/gobmx_publicaciones_siap/
SIAVI. Fracción arancelaria Aguacates (paltas) 08.04.40.01.00
http://www.economia-snci.gob.mx/
USDA-AMS. Custom report – Movement – Avocado
https://www.marketnews.usda.gov/mnp/fv-report-config-step1?type=movement
USDA-APHIS. Commodity Import Report (CIR): Avocado from Mexico
https://epermits.aphis.usda.gov/manual/index.cfm?action=cirReportP&PERMITTED_ID=9307
USDA-ERS. Fruit and tree nuts. Data by commodity – Avocados
https://www.ers.usda.gov/data-products/fruit-and-tree-nuts-data/data-by-commodity/