

Grape market insights for the United States and Latin America.
The grape production and marketing industry faces diverse global challenges ranging from inclement weather to intense market competition.
With climate change disrupting vineyard yields and quality, viticulturists are urging the embrace of sustainable growing practices.
Pests and diseases are also a major concern, necessitating effective integrated management strategies. The fiercely competitive market drives producers to enhance quality and diversify offerings to meet stringent standards.
While global grape production did decline in 2021, China remains the world’s leading grower by volume, followed by Italy, Spain, the United States, and France. Latin America also boasts a prominent market presence, with Argentina, Brazil, Peru, and Mexico playing significant roles.
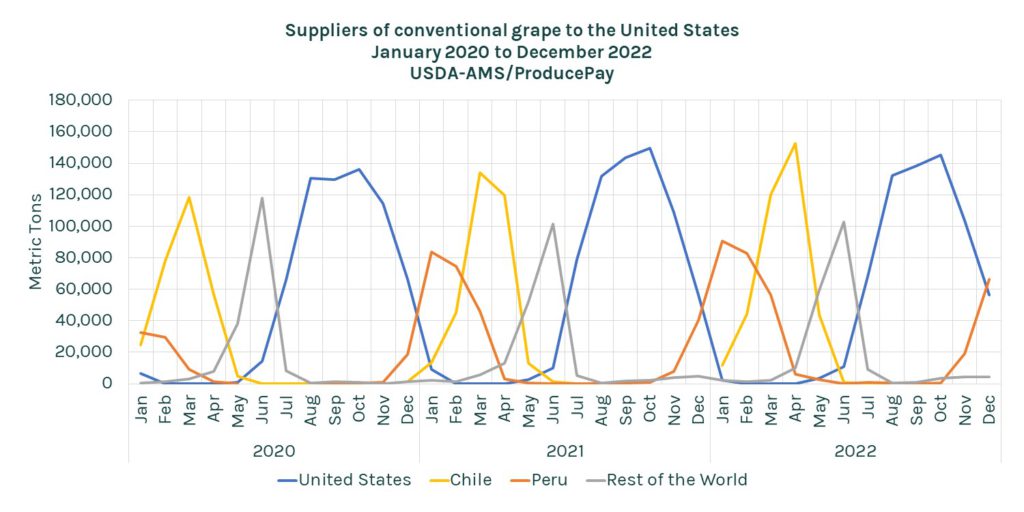
Grape volumes imported by the United States
In 2022, domestic grape production in the United States accounted for 42.3% of the country’s market supply, producing 660,062 metric tons. However, international growers have also played a prominent role in supplying the U.S. market.
Chile is the second-largest U.S. supplier, with 373,383 tons, followed by Peru, with 325,709 metric tons. Remarkably, Peru’s market share surged from 7.6% in 2020 to 20.9% in 2022.
The rest of the world exported 200,383 tons, most of which came from Mexico. The market is fiercely competitive, with overlapping production windows from July to December.
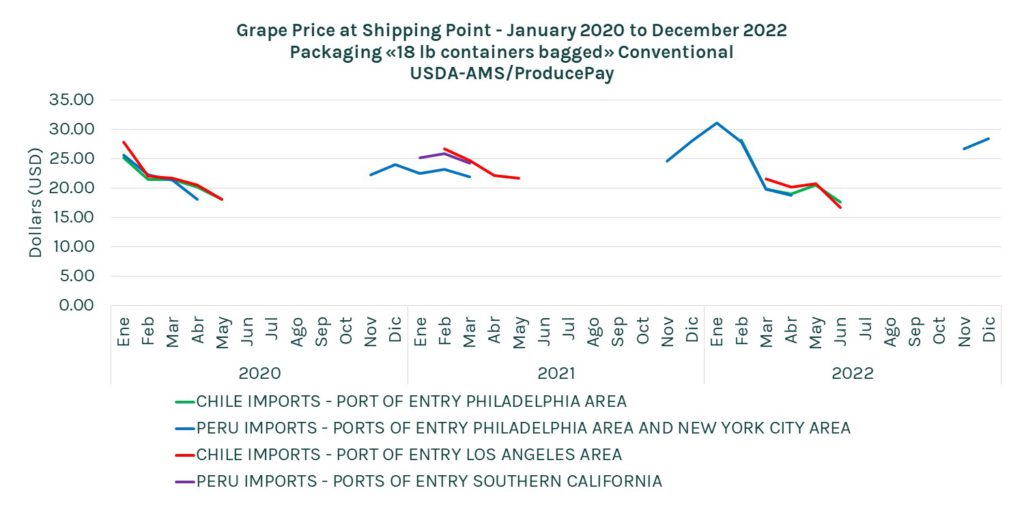
Price of grapes imported by the United States
Fresh grapes are predominantly sold in 18-pound (8.16 kg) bags in the U.S. market, but California also utilizes 19-pound packaging.
Similarly, 18-pound boxes and containers are also employed, though to a lesser extent. These packages typically range from $15 to $30, with a notable exception in January 2022, when Peruvian grapes reached $31.14 per package.
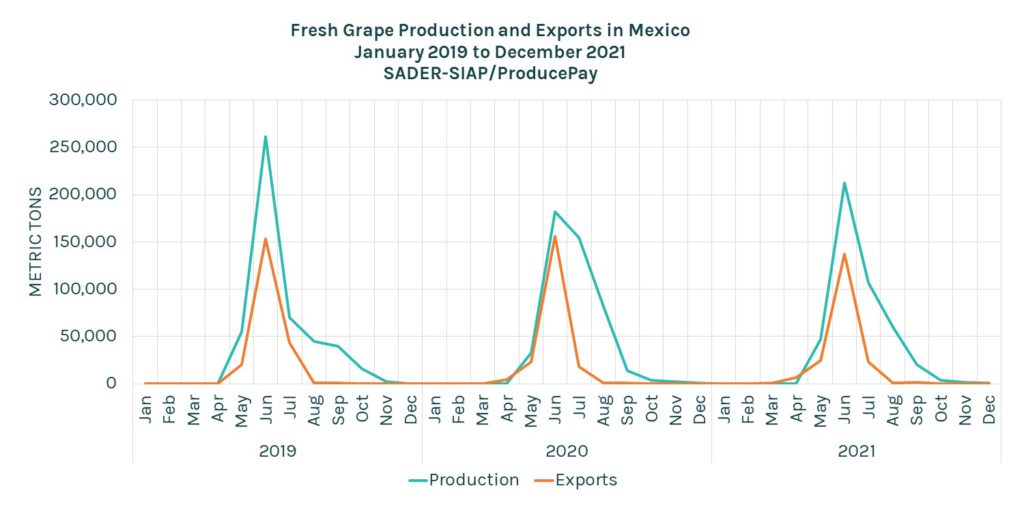
Grape production and exports in Mexico
In 2021, Mexico produced 452,125 metric tons of grapes, a 3.9% decrease compared to the previous year. Key producing states included Sonora, Zacatecas, and Baja California. Sonora stood out in terms of productivity, boasting an average yield of 15.2 tons per hectare.
Notably, Hermosillo, Sonora, emerged as the highest-producing municipality, contributing 24.8% to the national production.
Of the total output, approximately 43%, equivalent to 194,364 metric tons, was exported, primarily to the United States. In 2019, exports constituted 45% of total production, with 219,463 metric tons shipped overseas.
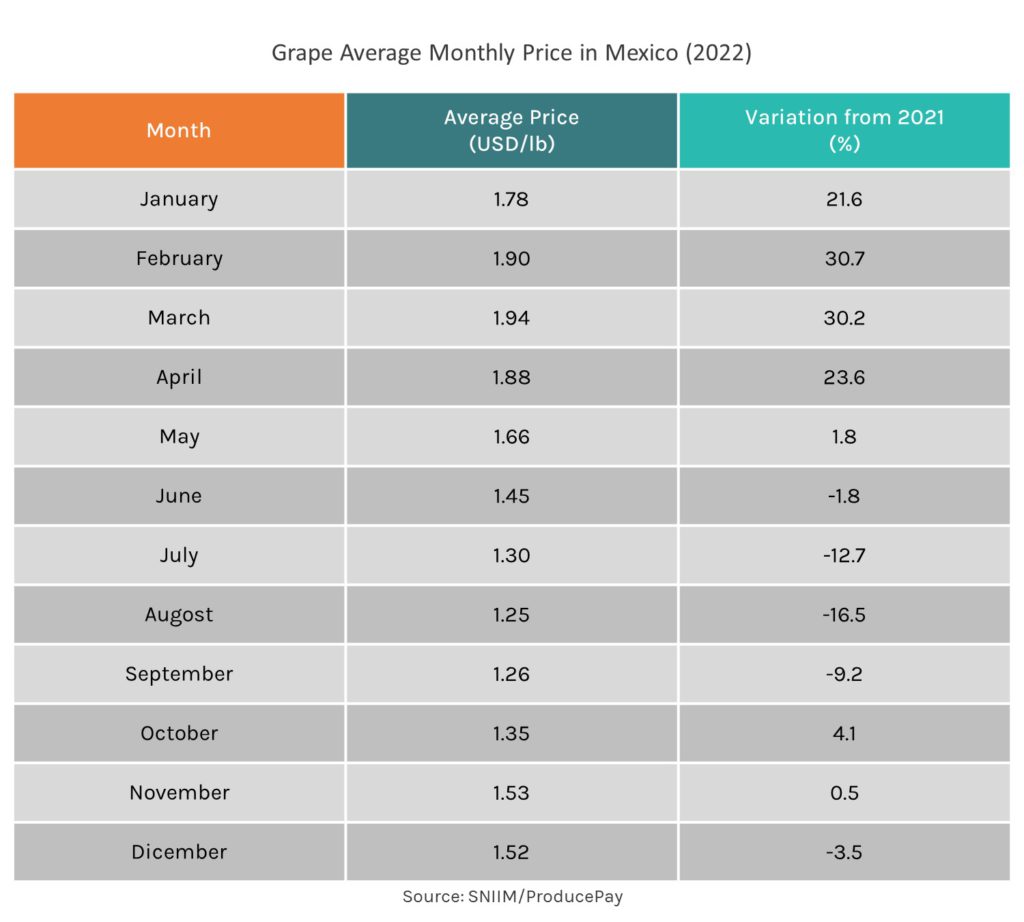
Grape prices in Mexico
In 2022, the average annual price of superior-quality grapes in Mexico reached $1.47 per pound, a 4.3% increase compared to the previous year.
Throughout the year, prices fluctuated, peaking in March at $1.94 per pound and hitting the lowest point in August at $1.25 per pound. Several months saw percentage increases exceeding 20% compared to 2021, influenced by demand, harvest availability, and other economic and social factors.
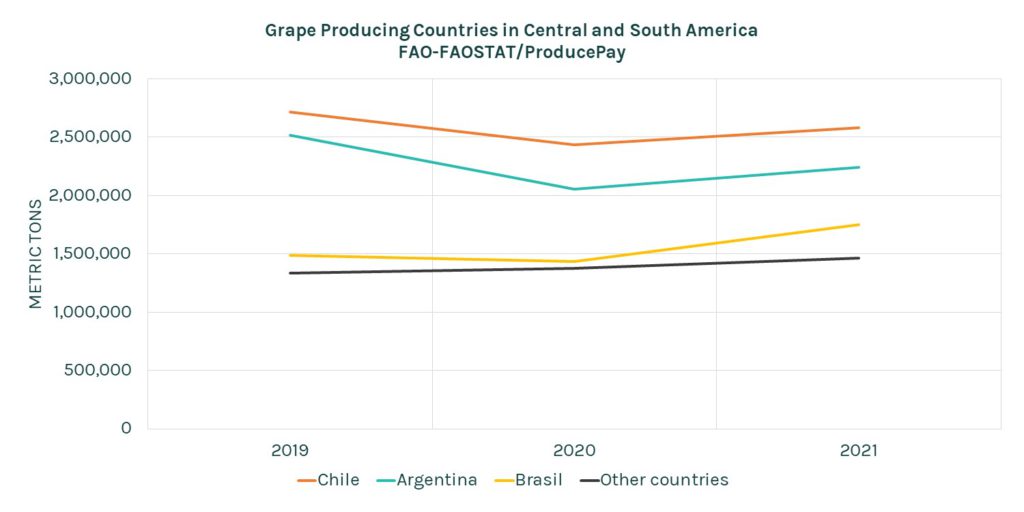
Production in Central and South America
Chile, Argentina, and Brazil are major grape producers in Central and South America. Chile is the leading regional producer, with 2,581,108 metric tons harvested in 2021, followed by Argentina and Brazil with 2,241,420 and 1,748,197 metric tons, respectively.
Brazil is steadily increasing its market share, accounting for 22% in 2021, while Chile and Argentina have slightly decreased to 32% and 28%. Other countries, such as Peru, Uruguay, and Colombia, contribute significantly to regional production, while several nations have smaller grape yields.
Learn more about the current grape situation
Download our Free Grape Analysis 2023 to learn crucial insights about grape production and marketing and get the information your business needs to thrive. Click here to download it now.
Sources: USDA-AMS, FAO-FAOSTAT, SADER-SIAP, SE-SNIIM