Tomato Exports: Overview
Tomato exports in the world presented an average annual increase in volume of 0.9% during the period 2011-2020. In 2020 there was a decrease of 7.6% from 2019, the peak year in volume, going from 8,074,526 to 7,458,437 tons. Mexico is the largest tomato exporter, and the United States is the largest importer, according to FAOSTAT, FAO’s main database.
Largest tomato exporters
In 2020, Mexico led tomato exports with 1,826,715 tons and a value of 2.6 billion dollars, accounting for 23.5% of the total volume and 26.4% of the total value of world exports.
In second and third place were the Netherlands and Spain with 1,024,069 and 734,223 tons, representing 13.2% and 9.4% of the total volume of tomato exported in the world, respectively. The first five positions were completed by Morocco with 7.7% and Turkey with 6.6%.
Top tomato exporters (2020)
| Country | Volume (t) | Volume (%) | Value (MD) | Value (%) |
| Mexico | 1,826,715 | 23.5 | 2,606 | 26.4 |
| Netherlands | 1,024,069 | 13.2 | 1,919 | 19.4 |
| Spain | 734,223 | 9.4 | 1,074 | 10.9 |
| Morocco | 596,719 | 7.7 | 770 | 7.8 |
| Turkey | 513,835 | 6.6 | 310 | 3.1 |
Source: FAO-FAOSTAT/ProducePay 2020
Largest tomato importers
The United States is the country that imports the most tomato annually, reaching 1,838,372 tons in 2020, which translated into 24.6% of the world total and generated 2,918 million dollars.
Top tomato importers (2020)
| Country | Volume (t) | Volume (%) | Value (MD) | Value (%) |
| United States | 1,838,372 | 24.6 | 2,918 | 29.9 |
| Germany | 739,194 | 9.9 | 1,561 | 16.0 |
| France | 507,342 | 6.8 | 718 | 7.4 |
| Russia | 467,068 | 6.3 | 525 | 5.4 |
| United Kingdom | 382,696 | 5.1 | 636 | 6.5 |
Source: FAO-FAOSTAT/ProducePay 2020
Largest tomato trade flows
The main tomato trade flow in the world is the volume sent by Mexico to the United States, 1,823,407 tons with a value of 2,601 million dollars in 2020. This is followed by the flow of tomatoes from the Netherlands to Germany and the flow of tomatoes from Morocco to France.
Main tomato trade flows in the world (2020)
| Origin | Destination | Volume (t) | Volume (%) | Value (MD) | Value (%) |
| Mexico | United States | 1,823,407 | 31.6 | 2,601 | 30.3 |
| Netherlands | Germany | 427,193 | 7.4 | 953 | 11.1 |
| Morocco | France | 359,348 | 6.2 | 485 | 5.7 |
| Spain | Germany | 185,620 | 3.2 | 326 | 3.8 |
Source: FAO-FAOSTAT/ProducePay 2020
Tomato exports from Mexico
Tomato is a product of great economic importance for Mexico, since a large part of the production is exported to the United States, constituting in 2020 the fourth agri-food product that left the country with more income from exports, although it is a crop that faces certain important challenges.
Where is Mexican tomato exported to?
The main destination for Mexican tomato exports is the United States, where virtually all the product is sent, 99.8% of the total volume exported in 2020. The second destination was Canada with 0.1% and the third destination was Japan with less than 0.1% of exports. Learn more about Mexican tomato production and exports.
Main destinations for Mexican tomato exports (2020)
| Country | Volume (t) | Volume (%) | Value (MD) | Value (%) |
| United States | 1,823,407.00 | 99.8 | 2601.2 | 99.8 |
| Canada | 2,737.00 | 0.1 | 4.1 | 0.2 |
| Japan | 564.00 | 0.0 | 0.9 | 0.0 |
| Other countries | 7.00 | 0.0 | 0.0 | 0.0 |
| Total | 1,826,715.00 | 100.00 | 2,606.10 | 100.00 |
Source: FAO-FAOSTAT/ProducePay 2020
What is the seasonality of Mexican tomatoes?
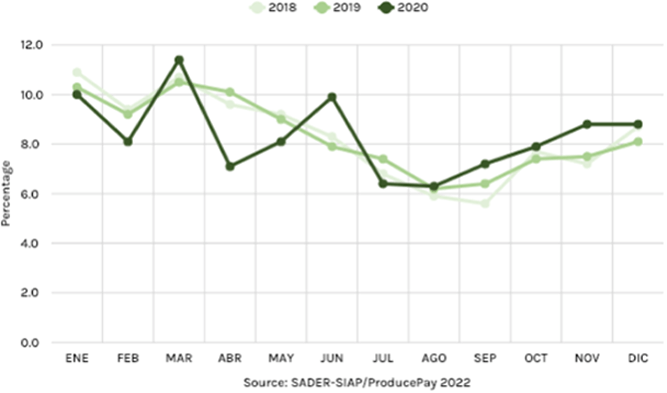
The peak export season runs from January to June, with the highest volumes in March, a contribution that complements production in the United States, which takes place mostly in California and Florida during the months of June to October.
In 2020 there was an unusual export peak in June, compared to the two previous years, as well as an unusual decrease in April of that same year; however, the lower export volumes remain fairly steady during the months of July, August and September.
Monthly tomato exports of Mexico (2018-2020)
Tomato exports from the Netherlands
The Netherlands is the second-largest exporter of tomatoes in the world and in 2020 its main destination was Germany, where 427,193 tons were shipped, representing 41.7% of the total volume exported, leaving an income of 952.6 million dollars. The second destination was the United Kingdom, to which 17.0% of the exported volume was sent.
Poland was in 3rd position with 66,225 tons and 101.7 million dollars, so it is clear that the Netherlands is very focused on the European market, a great strategy considering that Mexico dominates the US market but has minimal presence in Europe.
Main destinations for tomato exports from the Netherlands (2020)
| Country | Volume (t) | Volume (%) | Value (MD) | Value (%) |
| Germany | 427,193 | 41.7 | 952.6 | 49.7 |
| United Kingdom | 174,369 | 17.0 | 284.6 | 14.8 |
| Poland | 66,225 | 6.5 | 101.7 | 5.3 |
| Other countries | 355,949 | 34.8 | 579.6 | 30.2 |
| Total | 1,023,736 | 100 | 1918.5 | 100 |
Source: FAO-FAOSTAT/ProducePay 2022
Tomato exports from Spain
Spain has established as the third-largest exporter and in 2020 the main destination for Spanish tomatoes was Germany, where 185,620 tons were shipped, representing 25.4% of the total volume exported, leaving an income of 326.4 million dollars. The second and third destinations were France and the United Kingdom, where 15.4% and 13.4% of the exported volume were sent, respectively.
Something that is striking is that Germany is the main destination for exports from both the Netherlands and Spain, which is why it is the second-largest importer of tomatoes in the world.
Main destinations for tomato exports from Spain (2020)
| Country | Volume (t) | Volume (%) | Value (MD) | Value (%) |
| Germany | 185,620 | 25.4 | 326.4 | 30.5 |
| France | 113,027 | 15.4 | 133.9 | 12.5 |
| United Kingdom | 98,274 | 13.4 | 138.3 | 12.9 |
| Other countries | 335,152 | 45.8 | 472.3 | 44.1 |
| Total | 732,073 | 100.0 | 1,070.9 | 100.0 |
Source: FAO-FAOSTAT/ProducePay 2022
U.S. tomato imports
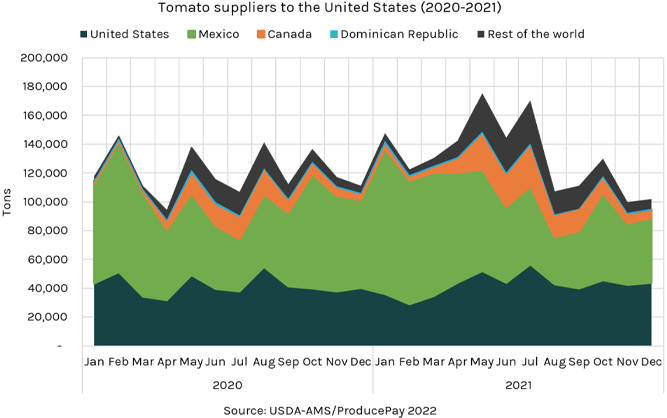
Mexico is the main supplier of tomatoes to the U.S. market, accounting for about 91% of the total volume imported by the United States. Canada and the Dominican Republic are in the second and third positions, shipping 151,287 and 10,157 tons in 2020, respectively.
The United States imports mainly hothouse, roma, cherry, grape and round varieties, of which hothouse and roma represent the largest volumes, having 518,281 and 628,397 tons imported from Mexico in 2021, respectively.
Tomato seasonality in the United States
Domestic production extends all year round, but the largest volume is obtained in February, May and August. Meanwhile, Mexico sends volume throughout the year, although the volume is higher at the beginning and end of the year.
Canada, on the other hand, contributes most of its volume between April and November, with the most important months being May to August, while the Dominican Republic has minimal shipments throughout the year, without a significant peak.
Cherry tomato price in the U.S.
For cherry tomatoes, the average annual price for tomatoes imported by the United States has remained relatively stable in recent years, with a price of 1.98 usd/kg in 2018 and 1.88 usd/kg in 2021.
The highest seasonal prices tend to occur between October and April, while the lowest prices are usually between June and September. 2020 was the season with the best prices for cherry tomatoes, having an average annual price of 2.2 usd/kg; while 2021 had the lowest prices in recent years, 1.47 and 1.44 usd/kg in August and September, respectively.
Prices of cherry tomatoes imported from the U.S. (usd/kg)
| Jan | Feb | Mar | Apr | May | Jun | Jul | Aug | Sep | Oct | Nov | Dec | Year | |
| 2018 | 2.19 | 2.04 | 1.87 | 1.79 | 1.78 | 1.87 | 1.72 | 1.89 | 1.85 | 2.27 | 2.21 | 2.22 | 1.98 |
| 2019 | 2.01 | 1.90 | 1.87 | 2.03 | 1.75 | 1.63 | 1.60 | 1.72 | 1.70 | 2.06 | 2.12 | 2.14 | 1.88 |
| 2020 | 2.29 | 2.33 | 2.37 | 2.18 | 2.25 | 2.13 | 2.12 | 1.95 | 2.09 | 2.29 | 2.12 | 2.23 | 2.20 |
| 2021 | 1.81 | 1.72 | 2.02 | 2.11 | 2.00 | 2.23 | 1.47 | 1.44 | 1.95 | 2.00 | 2.08 | 1.72 | 1.88 |
| Month | 2.03 | 1.99 | 2.09 | 2.11 | 2.00 | 1.99 | 1.73 | 1.70 | 1.91 | 2.12 | 2.11 | 2.03 | 1.98 |
Source: USDA-ERS/ProducePay 2022
Requirements to export tomatoes to the United States
On the U.S. side, the only admissible plant parts are the fruit and the cluster, which may enter through all ports, although the product is subject to inspection at the port of entry to ensure compliance with the general import requirements for fruits and vegetables set forth in 7 CFR § 319.56-3 of the Federal Code of Regulations, in addition to the APHIS permit PPQ-587.
In addition, the United States requires commercial shipments to be accompanied by a phytosanitary certificate issued by the National Plant Protection Organization (NPPO) of the country of origin, stipulating that the product is free of symptoms of tomato brown rugose fruit virus (ToBRFV).
It is important to mention that U.S. tomato import requirements may vary for each origin country; review the tomato import requirements by country.
Conclusion
World tomato exports have increased by an average of 0.9% each year from 2011 to 2020, a trend that will apparently continue for at least a couple of years, making this agri-food product extremely important in economic terms, mainly for the countries most involved in its trade flow, such as Mexico, the United States, the Netherlands and Germany.
Do you want to know more about tomato production and trade? Download and review our tomato analysis to learn more. Download it here!
Sources:
FAO-FAOSTAT. Crops and livestock products – Tomato trade
https://www.fao.org/faostat/en/#data/QCL
SADER-SIAP. Food & Agricultural Overview – tomato
http://nube.siap.gob.mx/gobmx_publicaciones_siap/
USDA-AMS. Custom report – Movement – Tomato
https://www.marketnews.usda.gov/mnp/fv-report-config-step1?type=movement
USDA-APHIS. Commodity Import Report (CIR): Tomato from Mexico
https://epermits.aphis.usda.gov/manual/index.cfm?action=cirReportP&PERMITTED_ID=4678
USDA-ERS. Vegetables and Pulses – Data by commodity – Tomatoes
https://www.ers.usda.gov/data-products/fruit-and-tree-nuts-data/data-by-commodity/

