
Current Situation of the Fresh Mango Market in the US
The fresh mango market in the United States has seen significant growth in recent years. This upward trend can be attributed to a combination of factors, including an increased consumer demand for fresh and exotic foods, and a widespread perception of the health benefits that mangoes can offer.
Moreover, marketing campaigns and promotions highlighting the taste and versatility of mango in various culinary dishes have contributed to its popularity among American consumers.
However, despite the generally positive outlook, the US fresh mango market faces some challenges related to phytosanitary regulations and fluctuations in import tariffs that can affect the supply and demand dynamics.
Sustainability and responsible farming practices are also becoming increasingly important to consumers. This is pushing growers and exporters to adopt more sustainable and ethical practices in their operations.
Import and Export Trends
From a supply perspective, the United States heavily relies on imports to meet its domestic demand for fresh mangoes, as local production is limited to Florida, California, and Hawaii.
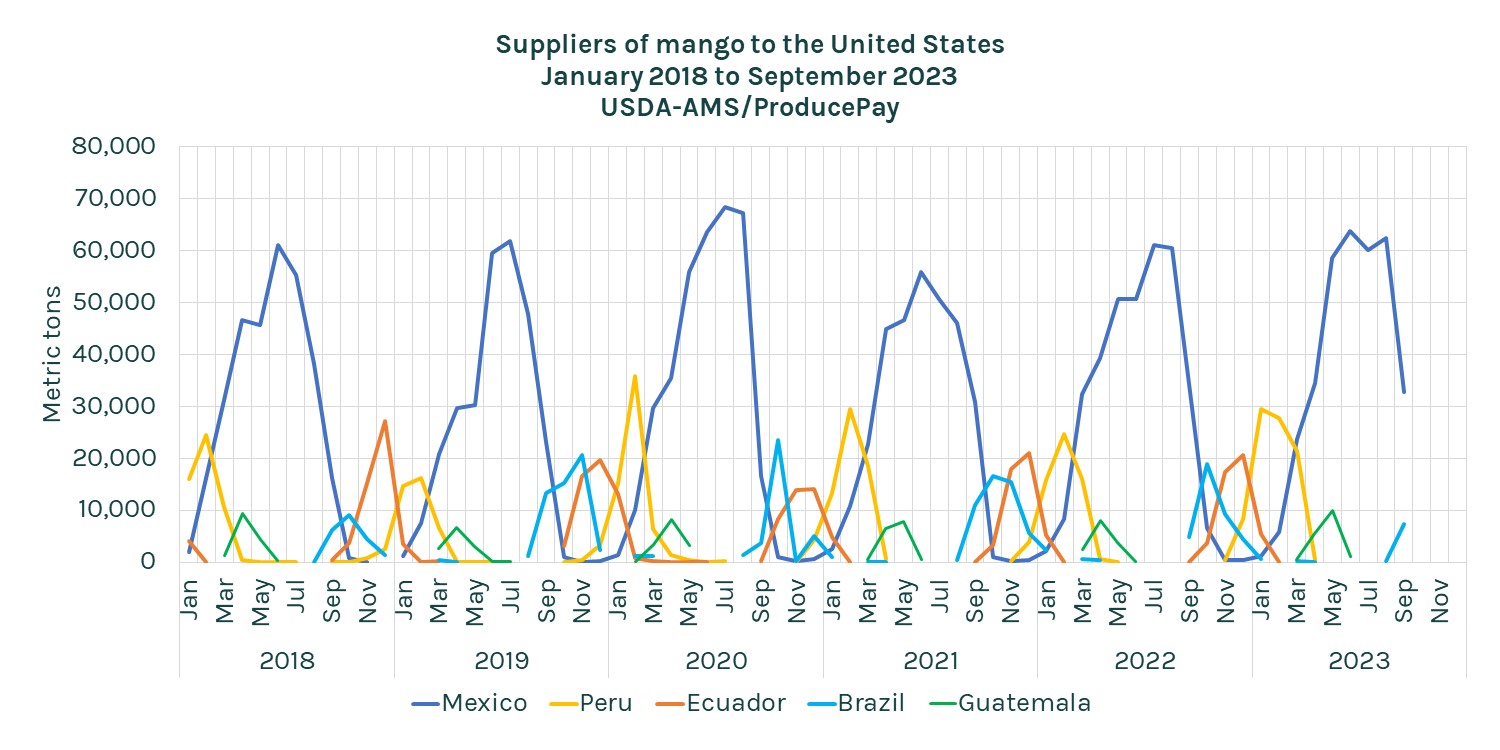
Mexico, as one of the world’s leading mango producers, continues to dominate the US market. However countries like Peru, Ecuador, and Brazil have also made inroads in terms of mango exports to the US over the past decade.
Diversifying suppliers has been crucial to ensure a consistent supply throughout the year, especially considering that mangoes are a seasonal fruit.
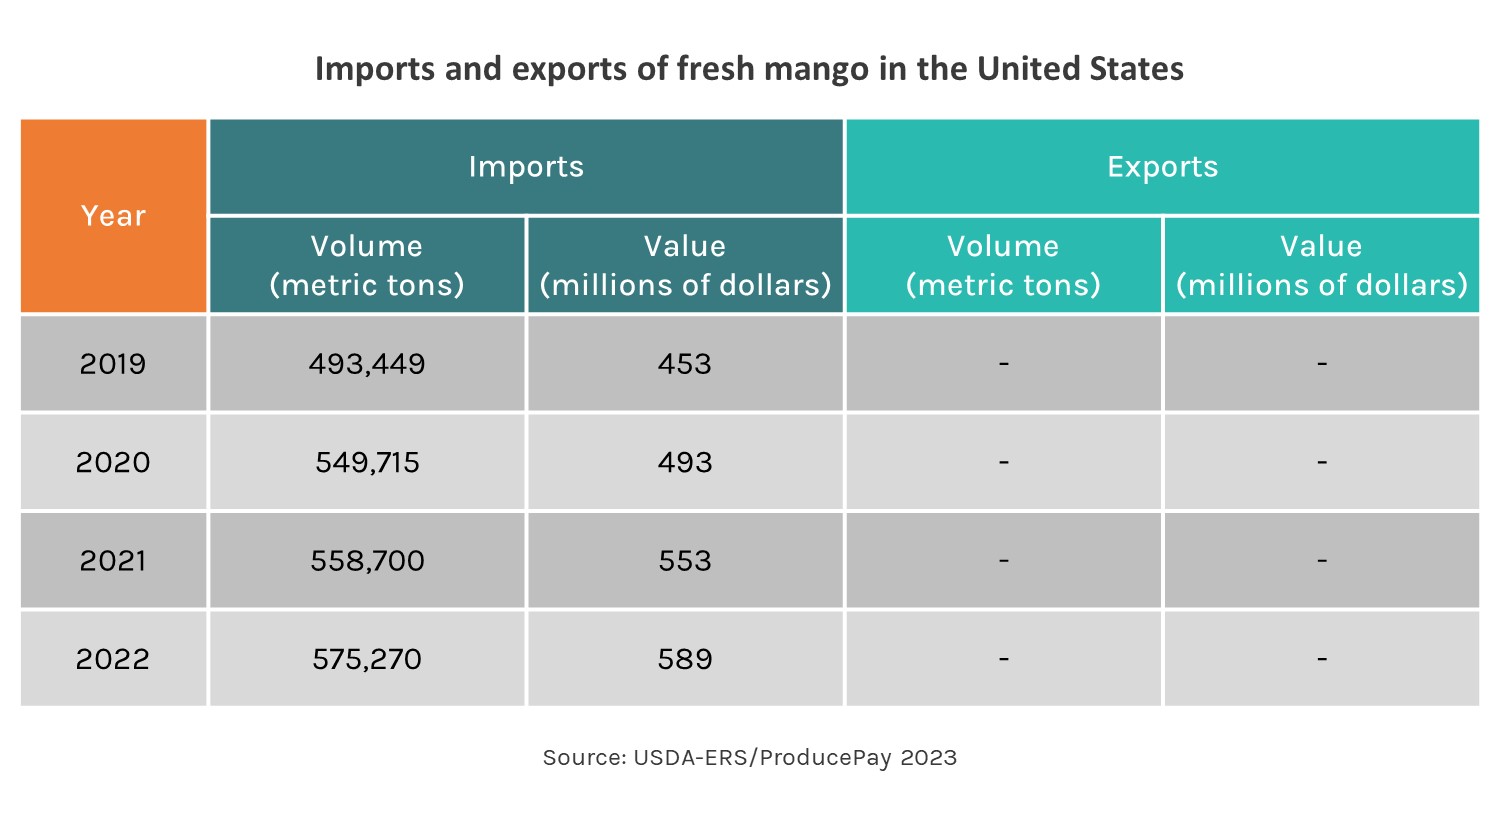
In the previous table, we can see that the volume of imports has gradually increased each year, reaching 575,270 tonnes in 2022, which marked a 16.6% increase compared to the 493,449 tonnes in 2019.
Furthermore, the annual import value has followed the same trend, with $453 million in 2019 and $589 million in 2022, a 30% increase.
US Mango Suppliers
The United States has few regions where mangoes can be grown in open fields, primarily in Florida. However, the constant threat of hurricanes and aggressive real estate development are factors working against mango production, opening the door for mango growers from other countries.
Mexico leading the supply
The dominance of Mexican mangoes in the U.S. market is undeniable. Over the last 6 years (2018-2023), imports of Mexican mangoes peaked between 60,000-70,000 tonnes, typically during the months of May, June, and July.
Peru eager for a larger market share
In 2020, Peruvian shipments of mangoes to the United States surpassed those of Ecuadorian mangoes, and since then, it has remained the second-largest supplier, with its highest shipments occurring in January, February, and March.
Ecuador stays in the fight
Despite losing its position as the second-largest mango supplier, Ecuador showed an interesting increase in volume in 2022 and 2023. It is worth noting that its highest shipments occur in November and December, right before Peru enters the market, making them complementary suppliers
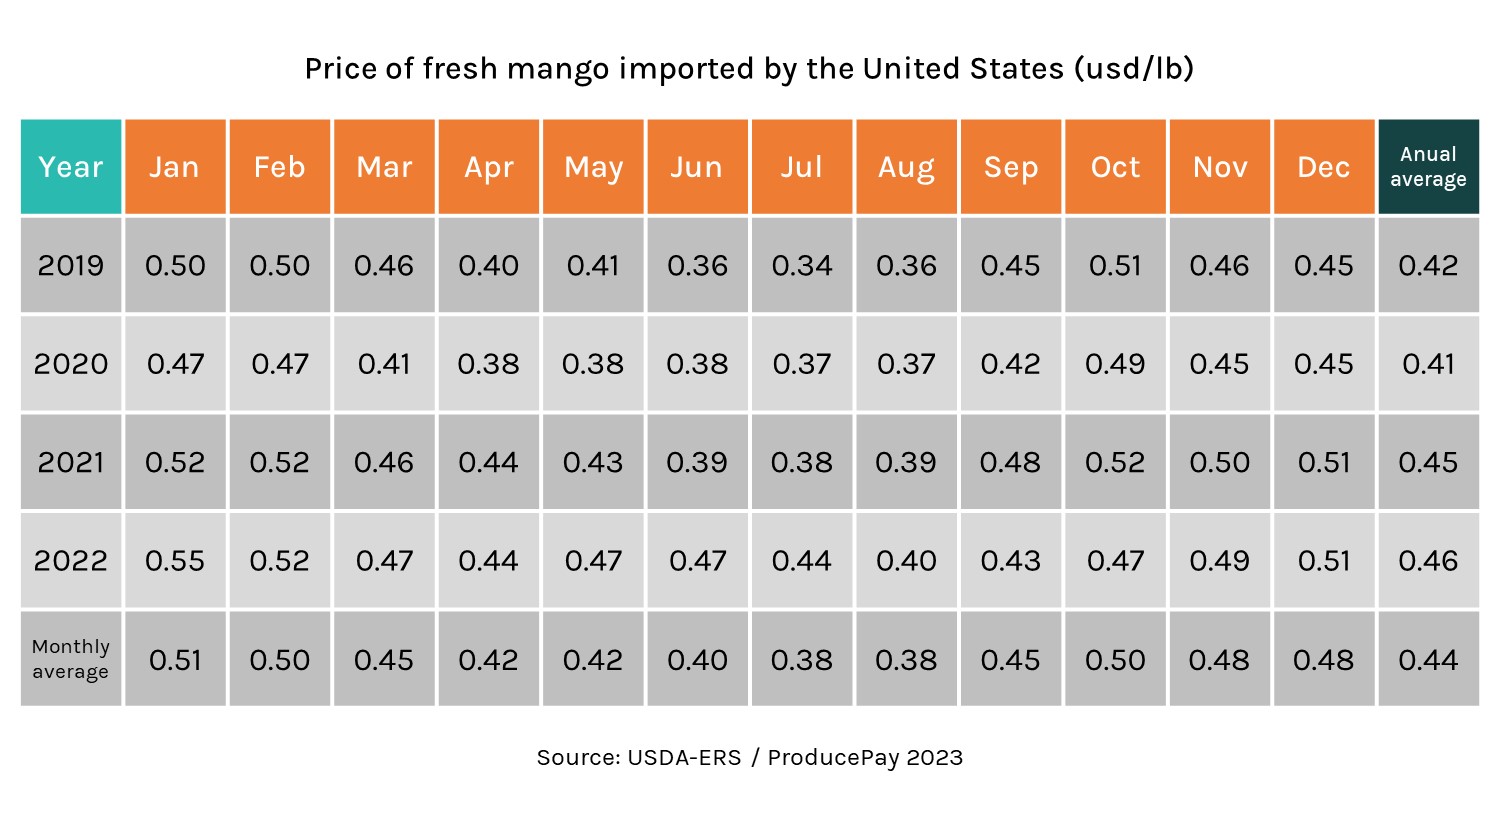
Average Monthly Prices
The average annual price for mangoes imported by the United States has remained stable in recent years, ranging between $0.41-$0.46 per pound, indicating market stability.
In 2019, the average annual price was $0.42/lb, with the highest price in October ($0.51/lb) and the lowest in July ($0.34/lb). In 2020, the average annual price slightly decreased to $0.41/lb, with October also recording the highest price ($0.49/lb) and April the lowest ($0.38/lb).
However, 2021 saw a slight increase to $0.45/lb. Price peaked in January, February and October ($0.52/lb) and hit its lowest in July ($0.38/lb). In 2022, the average annual price was $1.01 per kg, with the highest price recorded in January ($0.55/lb) and the lowest in August ($0.40/lb).
In summary, the monthly average price over the past few years shows a general trend of higher prices at the beginning of the year (January and February), a decrease toward mid-year, followed by a slight uptick toward the end of the year.
Market Outlook for 2024
The outlook for the fresh mango market in the United States for 2024 suggests a continuation in sustained growth in demand for this exotic fruit. According to USDA estimates, fresh mango imports are expected to rise in the coming years, driven by the increasing consumer demand and the expansion of marketing campaigns promoting mango consumption.
Mexico is expected to remain the key supplier for the American market, although other producing countries like Brazil, Peru, and Ecuador may strengthen their presence due to post-harvest infrastructure investments and supply chain improvements.
Additionally, diversifying the mango varieties offered and innovations in fresh packaging that keep the fruit in optimal conditions for longer are expected to play a crucial role in meeting consumer demand in 2024.
However, the market also faces challenges. Concerns related to climate change and its impact on mango production could lead to supply fluctuations.
Are you involved in mango production or trade?
At ProducePay, we provide solutions designed to empower your agribusiness. If you are a mango seller, we help you obtain working capital and improve your liquidity management. And if you are a buyer, we connect you with our extensive network of suppliers, facilitating faster payments. Our solutions include:
- Trading Platform: Streamline your supply chain by directly connecting with our verified sellers.
- Pre-Season: Secure tailored working capital for your business to manage operational and harvest expenses.
- Quick-Pay: Enhance your cash flow by receiving fast payments for your shipments, with the option for either sending or accepting payments.
- Insights: Real-time market intelligence that complements USDA data in a more user-friendly format.