
US Fresh Vegetables Suppliers
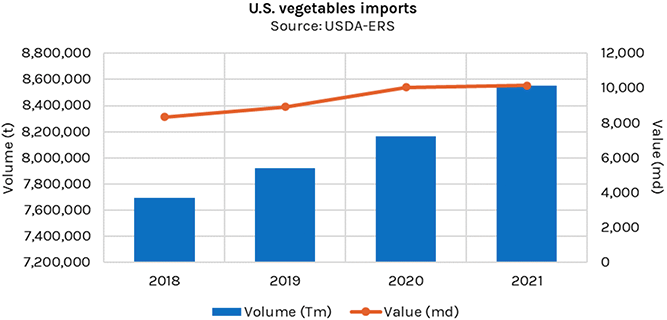
Between 2018 and 2021, the volume of fresh vegetable imports by the United States increased from 7,694,236 to 8,552,016 metric tons, an increase of 11.1%, while the value of those imports increased from 8,353 to 10,162 million dollars, so in this case the increase was 21.7%.
In addition, it is important to mention that in 2021, the ratio between imports and exports of fresh vegetables was 3.5 to 1, with 8,552,016 and 2,449,276 metric tons, respectively.
Major suppliers
The 3 countries from which the United States imported fresh vegetables the most in 2021 were Mexico, Canada and Peru, countries that accounted for 93.5% of the total volume of U.S. imports, which in turn translated into 92.3% of the total value.
Mexico: its geographical location is the reason why it constitutes the main supplier of fresh vegetables, going from 5,703,707 metric tons in 2018 to 6,419,982 metric tons in 2021, so there was an increase of 12.6% in that period. In addition, in 2021 it covered 75.1% of U.S. imports.
Canada: it was the second largest supplier because it contributed 15.3% of fresh vegetables imported by the United States in 2021, a figure that translated into 1,304,842 metric tons, so it had an increase of 4.4%, compared to the 1,249,437 metric tons obtained in 2018, so variation has been minimal.
Peru: In 2021, it sent 271,363 metric tons of fresh vegetables to the United States, so its market share was just 3.2%. In addition, it had an increase of 19.2% compared to 2018, when 227,612 metric tons were sent. As a reference, Peru sent only 4.2% of what Mexico sent.
What about exports?
The United States exported a total volume of 2,449,276 metric tons of fresh vegetables in 2021, of which 66.2% was shipped to Canada, while 12.2% and 3.5% went to Mexico and Japan, respectively, these being the main creditors of U.S. products, leaving 18.1% for all other countries.
In this sense, exports increased 6.1% in 2021, with respect to 2020, when the volume was 2,307,796 metric tons. Moreover, the 2021 volume translated into a value of 2,678 million dollars.
What can be concluded?
Historically, Mexico and Canada cover about 90% of U.S. fresh vegetables imports, a figure that will hardly decrease in the following years, and even the expectations are that it will increase a little more, especially due to the water shortage problems that California, the main agricultural state, is facing. This means, the margin of opportunity for other countries could be smaller, but still, 10% of fresh vegetable imports remains an excellent opportunity, both in terms of volume and value.