


Overview of the Fresh Blueberry Market in the US
The blueberry, first grown for sale in 1916, is a native North American crop that that has gained popularity among consumers, becoming a preferred berry – second only to the strawberry – in the US market.
Consumption has increased since the blueberry’s recognition as a superfood due to its nutritional content and the presence of anthocyanins and antioxidants, which impart the berry’s characteristic color.
The United States is the primary producer of blueberries, with 294,019 tons in 2020 (USDA NASS). It is also the primary importer, at 214,302 tons in 2020 (USDA ERS), which indicates that national production doesn’t cover the demand of the market, creating the opportunity for other countries to ship fresh blueberries to the United States.
Imports and exports of fresh blueberries in the United States
| Year | Imports | Exports | ||
| Volume (t) | Value (mdd) | Volume (t) | Value (mdd) | |
| 2017 | 137,715 | 841 | 16,841 | 94 |
| 2018 | 173,443 | 1,093 | 19,219 | 105 |
| 2019 | 207,984 | 1,237 | 19,140 | 102 |
| 2020 | 214,302 | 1,234 | 21,965 | 112 |
Source: USDA ERS
By analyzing this data, we can see that US blueberry imports increase with each passing year. In 2017, the country imported 137,715 tons, while in 2020 imports reached 214,302 tons— an increase of 55.6% in only 4 years.
The United States also exports fresh blueberries, mainly to Canada (93.1% in 2020), but also to South Korea, Taiwan, Japan, and Mexico. The relationship between imports and exports in 2020 was 10 to 1: for every 10 tons of blueberries imported, only 1 ton was exported.
Blueberry suppliers
The fact that the US market consumes more blueberries than national farmers are producing opens the door for fruit from other countries to be imported. Currently, the 3 primary countries in competition for greater participation in the market are Peru, Chile, and Mexico.
Peru, an explosive rise
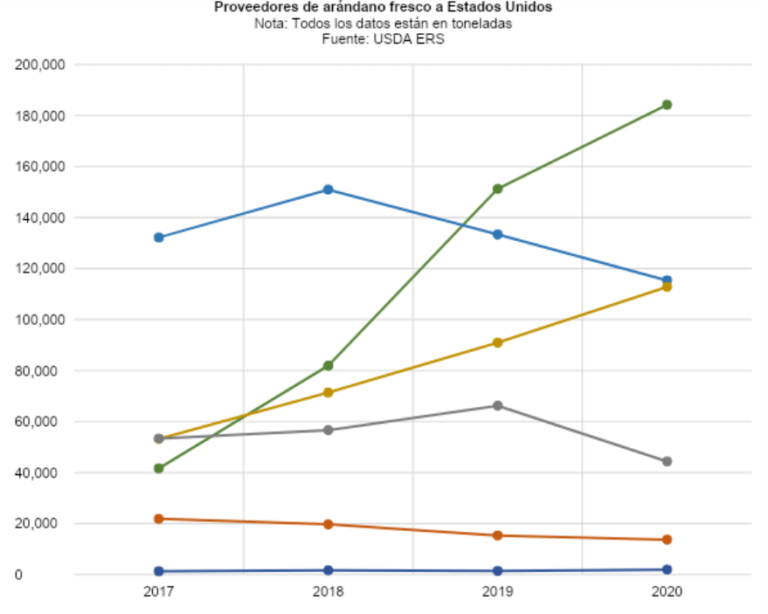
In 2019, Peru surpassed Chile to become the main blueberry supplier for the US market. This is remarkable, given that in 2016 the country shipped just 41,650 tons. Over the course of only 4 years, it increased its share by 342.3%, reaching 184,212 tons in 2020. This aggressive increase is due to low market prices, which Peru can sustain because of its ideal cultivation zones, and because it initially advanced its export window to avoid competing directly with Chile and Mexico.
Chile, in open decline
Chile has seen 3 years of decreased participation in the US market. Between 2018 (150,952 tons) and 2020 (115,366 tons) there was a 23.6% drop. It remains the second supplier, though it could very soon be surpassed by Mexico, especially because Chile is experiencing water shortages and fungal problems due to Arambarria destruens and Macrophomina phaseolina, which affect production.
Mexico, steady growth
During the last 4 years, the volume of Mexican blueberries entering the United States has increased consistently. Although not explosive, as in the case of Peru, this steady growth has allowed Mexico to come close to displacing Chile as the second supplier of blueberries. Contributing factors include varietal replacement and a significant transition to hydroponic production.
Price of imported fresh blueberries
The average annual price for blueberries imported by the United States is gradually decreasing, going from 6.49 USD/kg in 2017 to 5.68 USD/kg in 2020, a decrease of 12.5%. This decrease can be attributed to the increasing volume of imports each year, which leads to a standard decrease in prices.

Additionally, by analyzing the monthly price average for the last 4 years, we can see that the months with the highest prices are September, October, and November, which is when US farmers are no longer harvesting. Blueberry production in the United States begins in April and ends in September, with a peak season between May and July.
In fact, the months of July and August historically present the lowest prices for imported blueberries, at 3.90 and 4.47 USD/kg, respectively. These months mark the end of peak national production, which means that the volume of blueberries available in the market is high.
Prices of fresh blueberries imported by the United States (USD/kg)
| Year | Jan | Feb | Mar | Apr | May | Jun | Jul | Aug | Sep | Oct | Nov | Dec | Annual |
| 2017 | 4.61 | 4.45 | 6.60 | 8.73 | 6.99 | 5.32 | 4.18 | 4.47 | 8.04 | 8.90 | 8.30 | 7.28 | 6.49 |
| 2018 | 5.78 | 5.25 | 6.06 | 7.12 | 6.67 | 7.20 | 3.82 | 4.59 | 6.91 | 8.24 | 8.14 | 7.05 | 6.40 |
| 2019 | 5.84 | 5.56 | 6.16 | 6.53 | 5.42 | 5.26 | 3.59 | 4.15 | 7.83 | 7.87 | 6.55 | 5.82 | 5.88 |
| 2020 | 5.03 | 5.26 | 6.25 | 5.67 | 6.18 | 5.81 | 4.02 | 4.66 | 6.39 | 7.02 | 6.29 | 5.64 | 5.68 |
| Monthly | 5.32 | 5.13 | 6.26 | 7.01 | 6.31 | 5.90 | 3.90 | 4.47 | 7.29 | 8.01 | 7.32 | 6.45 | 6.11 |
Source: USDA ERS
Conclusion
The US market is hungry for quality blueberries, which means that in the coming years there will be an opportunity to increase the volume of shipments to the United States. While today’s top suppliers (Peru, Chile, and Mexico) will likely absorb most of this growth, there will also be room for new competitive players.
It’s important to remember that blueberries are not as perishable as other berries, and they can withstand longer transport. This dynamic means that Australia, South Africa, and various European countries could also supply blueberries to the US market.
USDA ERS. Data by Commodity – Blueberries
USDA NASS. Noncitrus Fruits and Nuts 2020 Summary
Blue Book Services. Blueberry seasonality overview