

Fresh Broccoli Market in the US
In the United States, broccoli is produced mostly in California, while Arizona complements with a smaller volume. However, California is facing significant challenges in terms of water shortages, which combined with rising temperatures has caused broccoli supply to decrease significantly.
Of course, this decrease benefits those farmers who remain, since lower supply meant an increase in domestic prices for fresh broccoli. However, this increase could stop because each year the U.S. market imports more broccoli to cover the drop in domestic production.
This trend is easily observable in the following table, which indicates that imports went from 191,984 to 250,809 metric tons between 2018 and 2021, a significant increase of 30.6% that has benefited farmers from other countries, who have seen the door increasingly open.
Fresh broccoli imports and exports in the U.S.
| Year | Imports | Exports | ||
| Volume (t) | Value (mdd) | Volume (t) | Value (mdd) | |
| 2018 | 191,984 | 204 | 71,956 | 105 |
| 2019 | 223,731 | 220 | 60,878 | 96 |
| 2020 | 245,836 | 261 | 59,921 | 96 |
| 2021 | 250,809 | 268 | 70,474 | 107 |
Source: USDA-ERS
In this sense, imports compete directly with domestic production throughout the year, which implies the risk of falling into a price war that harms U.S. producers, since their production costs are much higher.
Regarding the volume of fresh broccoli exports made by the United States, in 2021 Canada was the main destination with 78.6%, followed by Mexico and Japan, with 11.6% and 6.0%, respectively.
Broccoli suppliers
In 2020, the annual per capita consumption of fresh broccoli in the United States was 5.86 lb (2.7 kilograms), although the all-time high was reached in 2016 with 7.5 lb (3.4 kilograms). Despite this decline, broccoli remains one of the most popular vegetables among consumers since it is perceived as a highly healthy food.
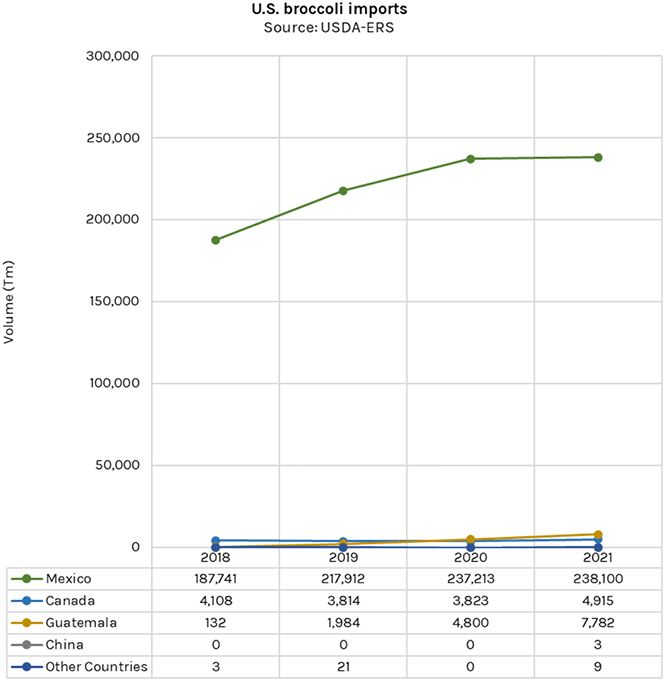
Mexico
Mexico is the undisputed leading supplier of broccoli to the U.S. market, with a volume of 238,100 metric tons in 2021, or 94.9% of total imports, despite having lost some market share, contributing 97.8% in 2018.
Canada
Although Canada contributed with more volume than Guatemala in the last 4 years, in 2021 it was surpassed by this other country, as it only contributed 2.0% of the volume of imports, with 4,915 metric tons, mainly because its market share has remained around 2.0%.
Guatemala
In 2018 it only sent 132 metric tons of fresh broccoli, so with respect to 2021 it had an increase of 5,895.5%, as in this last year it sent 7,782 metric tons, a volume that allowed it to surpass Canada and become the second largest supplier.
Imported fresh broccoli price
The average annual price for broccoli imported by the U.S. has remained relatively stable in recent years, with a price of 1.05 $/kg in 2018 and 1.09 $/kg in 2021, although with a decrease in 2019, when it stood at 0.99 $/kg.
In 2021, the months in which the highest prices were reached were from September to November, with highs of 1.28-1.36 $/kg. The lowest prices of the season were between January and April, with values of 0.92-0.95 $/kg.
Prices fall at the beginning of the year because it is when the market has the highest volume, as both production and imports are high, which causes supply to soar, meaning that prices must fall so that all the entire product can be sold.
Prices of fresh broccoli imported by the U.S. ($/kg)
| Year | Jan | Feb | Mar | Apr | May | Jun | Jul | Aug | Sep | Oct | Nov | Dec | Annual |
| 2018 | 1.08 | 1.04 | 0.97 | 1.03 | 1.05 | 1.05 | 0.97 | 1.02 | 1.04 | 1.08 | 1.16 | 1.16 | 1.05 |
| 2019 | 0.99 | 0.95 | 1.08 | 0.95 | 0.97 | 0.97 | 1.07 | 0.94 | 1.01 | 1.02 | 1.03 | 0.87 | 0.99 |
| 2020 | 1.10 | 0.99 | 0.95 | 0.89 | 0.93 | 1.21 | 1.06 | 1.08 | 1.31 | 1.01 | 1.09 | 1.04 | 1.05 |
| 2021 | 0.92 | 0.92 | 0.95 | 0.95 | 0.98 | 1.04 | 1.18 | 1.14 | 1.36 | 1.28 | 1.29 | 1.08 | 1.09 |
| Monthly | 1.00 | 0.95 | 0.99 | 0.93 | 0.96 | 1.07 | 1.10 | 1.05 | 1.23 | 1.10 | 1.14 | 1.00 | 1.04 |
Source: USDA-ERS
In conclusion
Given that the largest broccoli production in the United States takes place in California, a state that is facing serious water shortage problems, it is likely that in the following years the domestic production of this vegetable will decrease, demand that will have to be covered with more imports.
USDA-NASS. Vegetables 2021 Summary – Broccoli
USDA-ERS. Vegetables and Pulses Data – Data by Commodity – Broccoli
USDA-AMS. Custom Report – Movement – Broccoli
Statista. Per capita consumption of fresh broccoli in the United States