Current US Market for Fresh Cucumber
World production of cucumbers has been increasing annually for a decade. The harvested area appears to have stabilised, so the increase in production is therefore a result of an increase in average yield, which grew from 24.0 t/ha in 2010 to 39.3 t/ha in 2020.

Cucumber imports to the USA have consistently increased over the past few years, despite the fact that at least 5 of its own states produce large yields themselves. This shows that market demand is growing, though we must not ignore the fact that there have been adverse climate conditions in Florida and Michigan, the main producing states. These adverse conditions have affected internal production and obliged the USA to increase imports.
There is also the fact that the use of greenhouses and macro tunnels in Mexico means that nation can produce cucumbers almost year-round, a big competitive advantage that Mexican farmers have made good use of. They are now the US market’s main supplier of fresh cucumber.
Imports and Exports of Fresh or Chilled Cucumber to the USA
| Year | Imports | Exports | ||
| Volume (t) | Value (billions of dollars) | Volume (t) | Value (billions of dollars) | |
| 2017 | 881,748 | 686 | 13,898 | 15 |
| 2018 | 943,238 | 767 | 12,312 | 14 |
| 2019 | 972,503 | 824 | 14,336 | 18 |
| 2020 | 994,740 | 910 | 14,357 | 19 |
Source: USDA ERS
Another factor that may indicate that internal cucumber production has had its problems is the fact that the volume of exports has remained relatively stable over the past few years, which may also indicate that internal market demand is outstripping supply and, as a consequence, more imports are required.
Cucumber Suppliers
Statistics show that since 1970, when salad vegetables began to gain popularity, the consumption of cucumber in the USA started its 50-year climb, gradually knocking national production off its perch as it has failed to meet increased demand. Before 2005, internal production was higher than imports, but after that the opposite gradually happened until in 2020 90% of cucumbers were imported.
Mexico, the indisputable leader
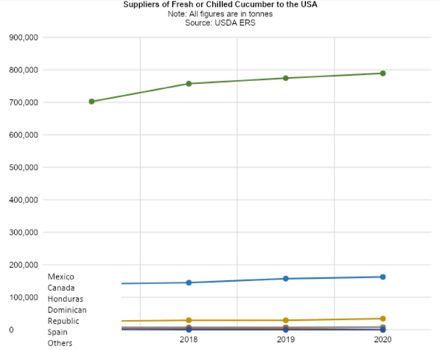
Mexico is not only the leading importer of fresh cucumber to the USA, but over the last few years it has succeeded in widening the gap with its nearest competitor, Canada.

Canada, still way ahead of the rest
Although Canada maintains a secure second position, way ahead of other competitors, sales have been increasing more slowly than hoped, which has definitely helped Mexico increase sales with every passing year. Lost ground is never easy to recover.
Honduras, not letting up for a second
Although Honduras is easily in third position, it is hard to see it ever competing with Canada for second position, particularly considering the fact that over the past few years its sales have increased only minimally.
Prices of imported fresh and chilled cucumber
The average annual price for imported cucumber in the USA has increased rapidly over the past few years, with prices rising from 0.80 USD/kg in 2017 to 0.92 USD/kg in 2020, despite increased supply due to more imports.
Between 2017-2020, highest prices were seen in September and October, with maximum levels of 0.94-1.13 USD/kg. Lowest prices were in December and February, when cucumber cost between 0.63-0.76 USD/kg.
Prices tend to fall towards the end of the year and the beginning of the next, because that is when Mexico produces and exports the largest volumes. In 2020, Mexican cucumber export was at its highest, 43.6%, compared to July and September, when the figure was at its lowest and prices consequently rose in parallel because supply to the market was lower.
Prices of Fresh or Chilled Cucumber imported to the USA (USD/kg)
| Year | Jan | Feb | Mar | Apr | May | Jun | Jul | Aug | Sep | Oct | Nov | Dec | Annual |
| 2017 | 0.63 | 0.72 | 0.70 | 0.80 | 0.81 | 0.91 | 0.83 | 0.77 | 0.98 | 0.94 | 0.82 | 0.68 | 0.80 |
| 2018 | 0.67 | 0.69 | 0.77 | 0.77 | 0.78 | 0.92 | 0.86 | 0.85 | 1.13 | 1.01 | 0.84 | 0.80 | 0.84 |
| 2019 | 0.80 | 0.77 | 0.79 | 0.80 | 0.82 | 0.89 | 0.82 | 0.79 | 1.04 | 1.03 | 0.88 | 0.92 | 0.86 |
| 2020 | 0.88 | 0.87 | 1.01 | 0.89 | 0.90 | 0.97 | 0.96 | 0.92 | 1.06 | 1.02 | 0.85 | 0.76 | 0.92 |
| Monthly | 0.74 | 0.76 | 0.81 | 0.81 | 0.83 | 0.92 | 0.87 | 0.83 | 1.05 | 1.00 | 0.85 | 0.79 | 0.86 |
Source: USDA ERS
Summing Up
With the trend in the US for eating more and more healthily, everything indicates that more and more cucumber will be consumed, which will open the doors to more Mexican and Canadian imports. It must be pointed out that the quality of Mexican cucumbers is better, due to better production conditions.
It is unlikely that any South American country will be able to really compete with Mexico and Canada when it comes to exports of cucumbers to the USA, so it only remains to see what Honduras will achieve over the next few years.
USDA ERS. Data by Commodity – Avocados
USDA NASS. Non citrus Fruits and Nuts 2020 Summary
Fresh Plaza. La demanda de ensaladas en EE. UU. eleva la importación de pepino fresco [Demand for salad ítems in the USA raises imports of fresh cucumbers]
